- Strategic Structuring
- Risk Mitigation
Capital Markets
- Digital Engagement
- Market Visibility
Public Perception
- Shareholders Services
- EDGAR Filings



The U.S. SPAC financing window has reopened, and the market test has shifted to what happens after the IPO
If one looks only at IPO volume, the U.S. SPAC market has clearly recovered in 2026.
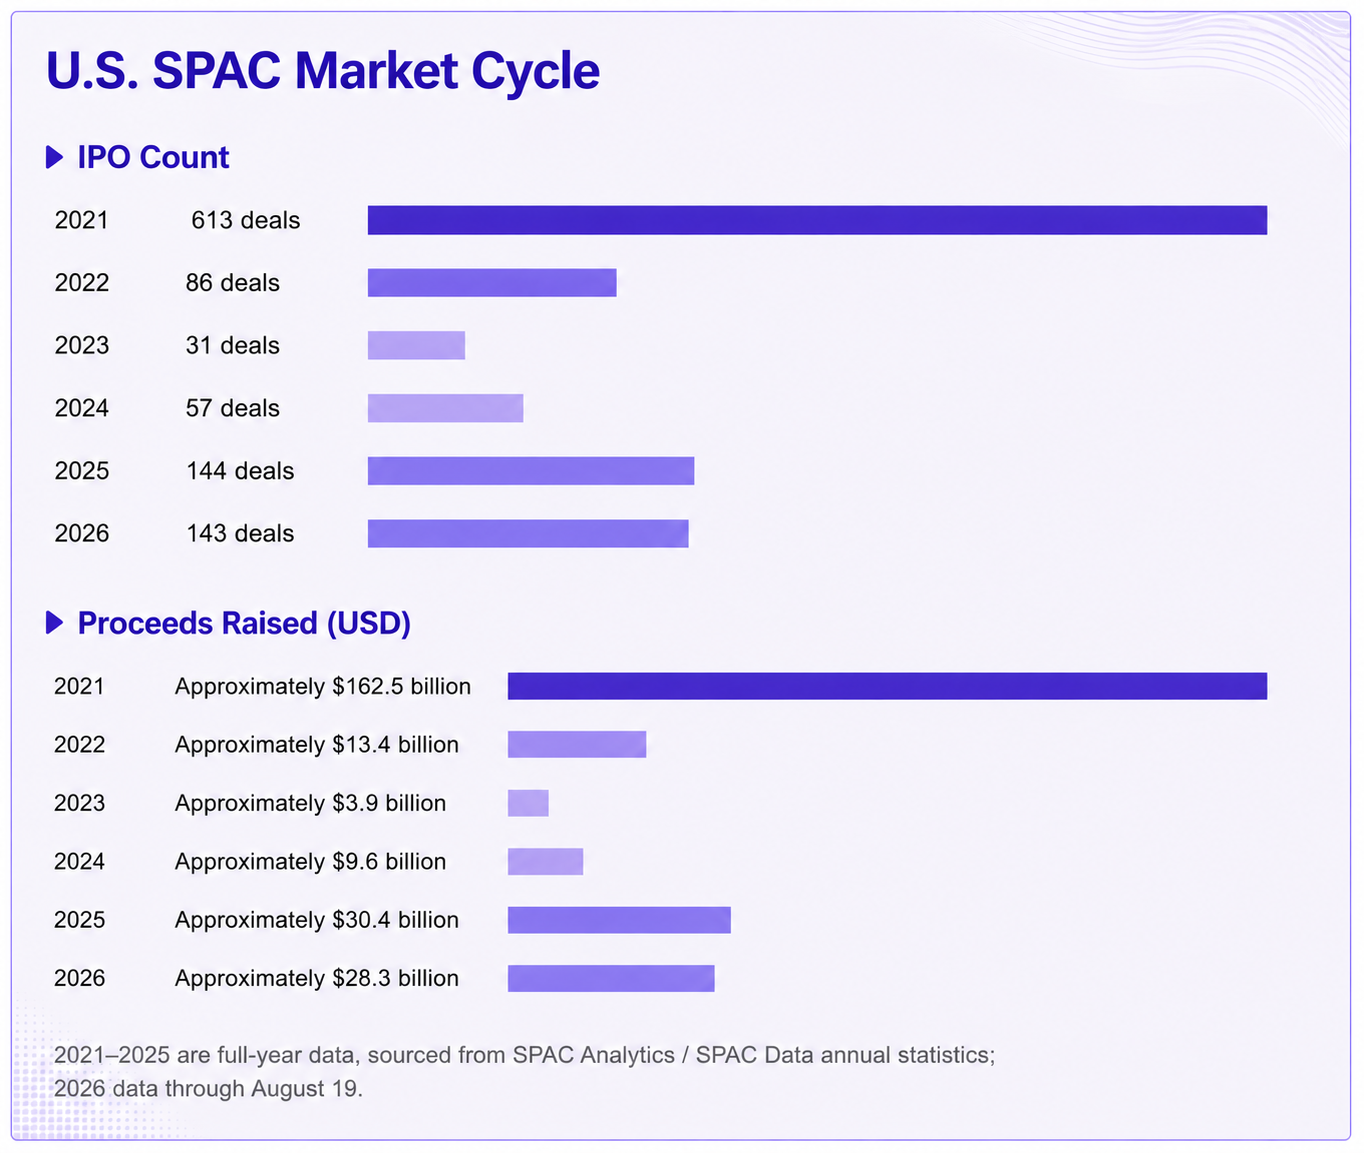
As of August 19, 2026, the U.S. market had completed 143 SPAC IPOs year to date, raising approximately $28.3 billion. IPO volume was already close to the full-year 2025 level. After the downturn from 2022 to 2024, the SPAC financing channel has become usable again.
However, an IPO is only the starting point of the transaction chain. Whether newly issued SPACs can find suitable targets, complete business combinations, leave enough cash for target companies after redemptions, and earn sustained recognition in the secondary market is the real test of the quality of this recovery. The available data looks more like a post-restart market test tha
In 2021, the U.S. SPAC market reached its historical peak, completing 613 IPOs and raising approximately $162.5 billion. The market then cooled rapidly: IPO volume fell to 86 in 2022, further to 31 in 2023, and then recovered to 57 in 2024.
In 2025, the primary market became active again, completing 144 IPOs and raising approximately $30.4 billion. By August 19, 2026, year‑to‑date IPO volume had reached 143, with approximately $28.3 billion raised.
Based on that cutoff date, 2026 IPO volume was approximately 23% of the 2021 level, while proceeds were approximately 17% of the 2021 level. Average proceeds per IPO were about $198 million, also below the approximately $265 million average in 2021. The market has emerged from its low point, but total issuance and average deal size remain well below 2021. For that reason, the current shift is more accurately understood as a recovery in the financing channel, not a full return of the SPAC boom.
Progress in the second half of the transaction chain has been slower. SPAC Research's market snapshot on August 5, 2026 recorded 373 active SPACs, of which 264 were still in the pre‑deal stage and 109 announced transactions were live.
These figures measure transaction inventory at different stages. They cannot be treated directly as a failure rate. Many SPACs issued in 2025 and 2026 have not yet entered the later stages of their transaction cycle. Still, the large number of SPACs still searching for targets or advancing announced transactions at least shows that IPO recovery has moved faster than the execution of business combinations. Over the next one to two years, the market's ability to identify targets, secure financing, and close transactions will determine whether this issuance cycle can turn into effective deals.
The investors who buy SPAC IPO securities are not necessarily the same investors who are willing to hold the shares of the post‑business‑combination public company over the long term.
At the IPO stage, investors usually benefit from trust‑account protection and may choose to redeem before the business combination. An investor may accept the risk‑return profile of a SPAC IPO security but reject the target company, transaction valuation, or financing terms later selected by that SPAC. The fact that a new SPAC can raise capital is therefore not inconsistent with the possibility of high redemption levels at the business‑combination stage.
Market statistics cited by Mayer Brown show that, under certain methodologies, quarterly SPAC redemption rates exceeded 90% for much of 2023 and 2024, then fell to approximately 79% in the third quarter of 2025 and further to approximately 68% in the fourth quarter. Redemption pressure has eased in some transaction samples, but that is not enough to conclude that the redemption problem has disappeared.
Redemption rates depend heavily on methodology. Redemptions in extension votes and redemptions in final merger votes are not the same metric. Using original IPO shares or remaining public shares as the denominator can also produce different results. Averages, medians, and weighted averages likewise should not be mixed. Therefore, without specifying the sample and calculation method, it is not appropriate to summarize the market with a single "2026 SPAC redemption rate," or to directly mix redemption‑rate series from different institutions.
Redemptions directly affect the amount of cash actually received by the target company. Suppose a SPAC has $300 million in its trust account and 80% of public shareholders ultimately choose to redeem. Before taking transaction expenses and new financing into account, only about $60 million would remain in the trust.
Therefore, a SPAC's nominal trust size does not represent the final financing amount available to the target company. When evaluating a transaction, one must also examine post‑redemption net cash, whether the PIPE is committed, whether the minimum cash condition can be satisfied, and the pricing, rights, and dilution impact of any new financing.
Large PIPEs were common in 2021 SPAC transactions. PIPE usually refers to institutional private placement financing conducted alongside a business combination. It can supplement cash and may also provide some external validation for the transaction valuation.
The financing environment has changed significantly. Mayer Brown's June 2026 market analysis shows that 44% of completed business combinations in 2025 closed with no incremental financing, compared with only 4% in 2021. In 2026, the market has also seen some PIPEs close near the traditional $10 reference price, but capital has become more selective on project quality, valuation, and terms.
To improve closing certainty, recent transactions have used a range of structural arrangements, including sponsor promote concessions, share forfeitures, earnout shares, non‑redemption arrangements with investors, backstop financing, forward purchase agreements, preferred‑stock or convertible‑debt financing, and additional sponsor contributions to the trust account.
These arrangements do not serve the same purpose. Some are used to ease conflicts of interest or dilution, some support minimum cash conditions, and others directly supplement financing or improve the economics for investors who continue holding. Together, they show that sponsor economics, financing cost, and dilution are being more explicitly repriced in transactions. They do not mean that the traditional sponsor model has disappeared.
Sponsor composition is also changing. ICR's second‑quarter market report, published July 1, 2026, shows that the SPAC market completed 55 IPOs in Q2 2026, raising approximately $9.8 billion, and that approximately 53% of SPAC IPOs came from repeat sponsors with prior SPAC experience. Experience typically helps with target screening, SEC review, financing, shareholder communication, and transaction execution. Repeat sponsors also have stronger incentives to protect reputation and future fundraising capacity.
However, the 53% figure measures sponsor experience composition. It does not directly prove that transaction quality has improved. What it better shows is that the current primary market is more inclined to allocate capital to teams with execution records and continuing fundraising capability.
The SEC, or U.S. Securities and Exchange Commission, adopted its final SPAC rules on January 24, 2024, and they became effective on July 1 of the same year. The new rules did not prohibit SPACs. Instead, they raised disclosure and liability standards for business combinations, bringing them closer to the requirements faced by operating companies entering the public market through a traditional IPO.
Regulation S‑K Subpart 1600 requires more detailed disclosure of sponsor compensation, conflicts of interest, dilution, redemptions, transaction financing, and related matters. In some business combinations, the target company must also sign the registration statement as a co‑registrant and directly assume Securities Act liability related to the registration statement.
As a result, target companies need to prepare audited financial statements, risk factors, internal controls, capital structure, related‑party transactions, and the basis for projections earlier in the process. A SPAC business combination can no longer be treated as a lower‑regulation shortcut to going public.
Liability around projection disclosure has also become more sensitive. Item 1609 requires disclosure of the purpose of projections, the party that prepared them, key assumptions, and whether the projections still reflect the current views of management or the board. At the same time, the statutory safe harbor for forward‑looking statements under the PSLRA no longer applies to relevant blank‑check companies, including SPACs. The rules do not prohibit the use of projections, but transactions that rely on long‑term high‑growth forecasts to support valuation need to handle disclosure support and potential liability more carefully.
There are two other regulatory boundaries that are easy to misstate. The SEC did not adopt proposed Rule 140a, so it is not accurate to broadly say that SPAC IPO banks automatically become statutory underwriters in the business combination. Whether a party is an underwriter still depends on the specific facts and the manner of participation. The SEC also did not adopt proposed Rule 3a‑10 as an Investment Company Act safe harbor. Whether a SPAC raises Investment Company Act issues still depends on its actual assets, activities, and duration.
Exchange rules have further compressed timing flexibility. Nasdaq and NYSE American now both impose stricter listing constraints on the 36‑month deadline for SPAC business combinations. Even if shareholders approve a charter amendment to extend the SPAC's life, the exchange may not necessarily permit continued listing for the same extended period.
In practice, SEC review, financial statements, shareholder votes, redemption processing, financing arrangements, and exchange deadlines need to be built into one closing timetable. In March 2025, the SEC's Division of Corporation Finance expanded nonpublic review procedures for draft registration statements, allowing qualifying business combinations to use confidential submission procedures in certain circumstances. This change provides procedural convenience, but it does not reduce substantive disclosure requirements.
For target companies, transaction evaluation cannot stop at headline valuation and SPAC trust size. Post‑redemption net cash, PIPE terms, the reliability of backstop financing, minimum cash conditions, post‑listing runway, and public‑company readiness all affect the company's ability to survive after completing the merger.
For sponsors, the issue is not only whether they can complete a transaction. In a market where many SPACs are searching for targets at the same time, pushing a weak‑quality project could damage future fundraising capacity and market reputation, while also increasing directors' and officers' liability risk. When necessary, terminating an unsuitable transaction is also part of how the market evaluates sponsor judgment.
Directors' and officers' responsibilities run across multiple stages: SPAC IPO disclosure, decision‑making during the target‑search period, the business‑combination registration statement, the shareholder vote and redemption process, and the post‑combination company's ongoing disclosure. Board records on valuation, projections, financing, conflicts of interest, and dilution may all be reviewed after the fact.
Gallagher noted in its 2026 market commentary that SPAC directors' and officers' liability insurance pricing has fallen significantly from its 2020‑2021 peak, while insurers have accumulated more historical claims data and underwriting competition has also increased. Gallagher also noted that, as SPAC issuance activity recovers, the D&O insurance market may gradually stabilize or harden in the second half of 2026, while remaining well below the prior peak. Pricing for any specific project still depends on the sponsor, term, jurisdiction of formation, and underwriting conditions; regardless of how pricing changes, premium levels do not mean the substantive liability borne by directors and officers has declined in parallel.
Legal counsel, EDGAR filing service providers, transfer agents, proxy solicitation teams, and shareholder‑meeting teams need to manage the business combination as one unified complex closing project. SEC review, EDGAR submission, financial statements, mailing timelines, record dates, shareholder meetings, redemption processing, transfer‑agent coordination, exchange deadlines, financing conditions, and post‑combination reporting obligations are interconnected. Delay in any one link can hold up a transaction whose economic terms have already been agreed.
For SPACs in 2026, execution capability is mainly reflected in whether they can complete adequate disclosure within the deadline, secure executable financing, and preserve enough cash for the company after redemptions. Listing speed is no longer the only benchmark.
The basic SPAC instrument has not changed, but the financing, regulatory, and investor environment around it has.
|
Dimension |
2021 Peak |
2026 Market |
|
IPO scale |
613 deals / approx. $162.5B |
143 deals / approx. $28.3B as of August 19 |
|
Sponsor profile |
Rapid expansion of participants |
Approx. 53% of Q2 IPOs came from repeat sponsors |
|
PIPE |
Large PIPEs were common |
Capital remains available, but project screening is stricter |
|
Redemptions |
Continued rising through 2021 |
Some samples have improved, but high redemptions remain common |
|
Regulation |
Before the 2024 final rules |
Subpart 1600, co‑registration, projection disclosure, and other requirements are effective |
|
Deal deadline |
Relatively more flexible |
Nasdaq / NYSE American 36‑month constraints are stricter |
|
Market focus |
Whether a transaction can close |
Whether it can close at a reasonable valuation, with sufficient cash and adequate public‑company readiness |
IPO volume mainly measures primary‑market issuance capacity. It cannot by itself prove that the entire SPAC market has repaired. The next stage is better assessed by the completion rate of announced transactions, redemption rates under a consistent methodology, actual cash received by target companies, PIPE financing quality, six‑month and twelve‑month post‑combination performance, and the number of liquidations.
Historical performance still argues for caution. Relevant market statistics show that, among recent business‑combination companies, approximately four‑fifths traded below the traditional $10 reference price within one year after the merger. That ratio changes with the sample and share‑price updates, and should not be understood as a fixed historical failure rate for the entire market.
This historical statistic cannot be used directly to judge SPACs issued in 2025 and 2026, because many of them are still searching for targets or are in the transaction‑execution stage. The more meaningful observation period may be 2027‑2028, when SPACs from this issuance cycle will gradually approach their business‑combination deadlines.
If, over the next two years, the inventory of SPACs searching for targets declines, more announced transactions close successfully, redemption rates fall under a consistent methodology, the actual cash received by target companies increases, financing terms improve, and post‑combination share prices and operating performance become more stable, then this recovery will be more fully validated.
If IPOs continue to increase while many SPACs remain unable to find targets for extended periods, announced transactions are frequently terminated, redemption rates stay high, financing relies more heavily on discounts and complex structures, and liquidations rise again, then the 2026 shift will still mainly represent the reopening of the financing window rather than a completed repair of the SPAC model.
Follow-Up Indicators
As of August 2026, the recovery in the U.S. SPAC primary market is supported by data: sponsors have regained fundraising capacity, and private companies have begun to reassess the SPAC listing route. The available data can prove that the financing channel has recovered, but it is not enough to prove that the 2021 market model has returned.
The current market is smaller, regulatory and disclosure requirements are higher, and capital is more sensitive to sponsor experience, project quality, and transaction terms. Post‑redemption cash, PIPE financing terms, sponsor economics, and target‑company public‑company readiness are becoming the practical constraints on whether transactions can close and whether the listed company can continue operating afterward.
SPACs do not need to return to more than 600 IPOs in a year to have market value. A market with smaller issuance scale, more experienced participants, more realistic financing conditions, and more transparent economic arrangements may be more stable than the 2021 peak. But that judgment still needs support from future data.
Over the next two years, the completion rate of announced transactions, actual cash delivered after redemptions, post‑combination operating performance, and liquidation volume will say more about whether this recovery can last than the number of IPOs.
[1] Brookline Capital Markets — Letter 33, "SPACs, Splits and the Limits of Financial Engineering," August 18, 2026.
[2] SPAC Analytics / SPAC Data — U.S. SPAC IPO historical data and market tables, including 2024 SPAC IPO count and proceeds.
[3] Boardroom Alpha — SPAC data page, YTD IPO count and proceeds as of August 19, 2026; post‑de‑SPAC trading‑performance discussion.
[4] SPAC Research — U.S. SPAC pipeline snapshot, August 5, 2026.
[5] ICR — Q2 2026 SPAC Market Update & Outlook, July 1, 2026.
[6] Mayer Brown / Free Writings — redemption trends, PIPE financing and no‑incremental‑financing share.
[7] U.S. Securities and Exchange Commission — Special Purpose Acquisition Companies, Shell Companies, and Projections, Release No. 33‑11265; SEC Release No. 2024‑8.
[8] SEC Division of Corporation Finance — 2025 expansion of draft registration statement / nonpublic review procedures for qualifying de‑SPAC transactions.
[9] Nasdaq Rule 5100 and 5800 Series; NYSE American rule changes concerning the 36‑month business‑combination deadline.
[10] Delaware Court of Chancery / American Bar Association analysis — MultiPlan and Hennessy.
[11] Gallagher — 2026 Guide to D&O Insurance for SPAC IPOs and de‑SPAC insurance commentary.
Disclaimer: This article is provided by First Cover for general informational purposes only and does not constitute legal, investment, insurance, or financial advice. The market data in this article is based on public information available in August 2026 and the data sources used in the English research draft; real‑time SPAC data, transaction status, and insurance market conditions may change over time. Readers should refer to official information from the relevant data providers, regulators, exchanges, and market sources.
 APAC Companies Seeking U.S. IPOs in H1 2026: Filing Activity Stayed Active, but Conversion Still Depends on Quality
The SPAC Financing Window Reopens, but the Real Test Has Only Just Begun
APAC Companies Seeking U.S. IPOs in H1 2026: Filing Activity Stayed Active, but Conversion Still Depends on Quality
The SPAC Financing Window Reopens, but the Real Test Has Only Just Begun